Guides
How to Read an HPLC Chromatogram: The Complete Guide for Research Peptide Buyers
Learn how to read an HPLC chromatogram, understand what chromatographic peaks represent, interpret purity reports correctly and compare research peptide suppliers with greater confidence.
FutureCell Research Team · 16 min read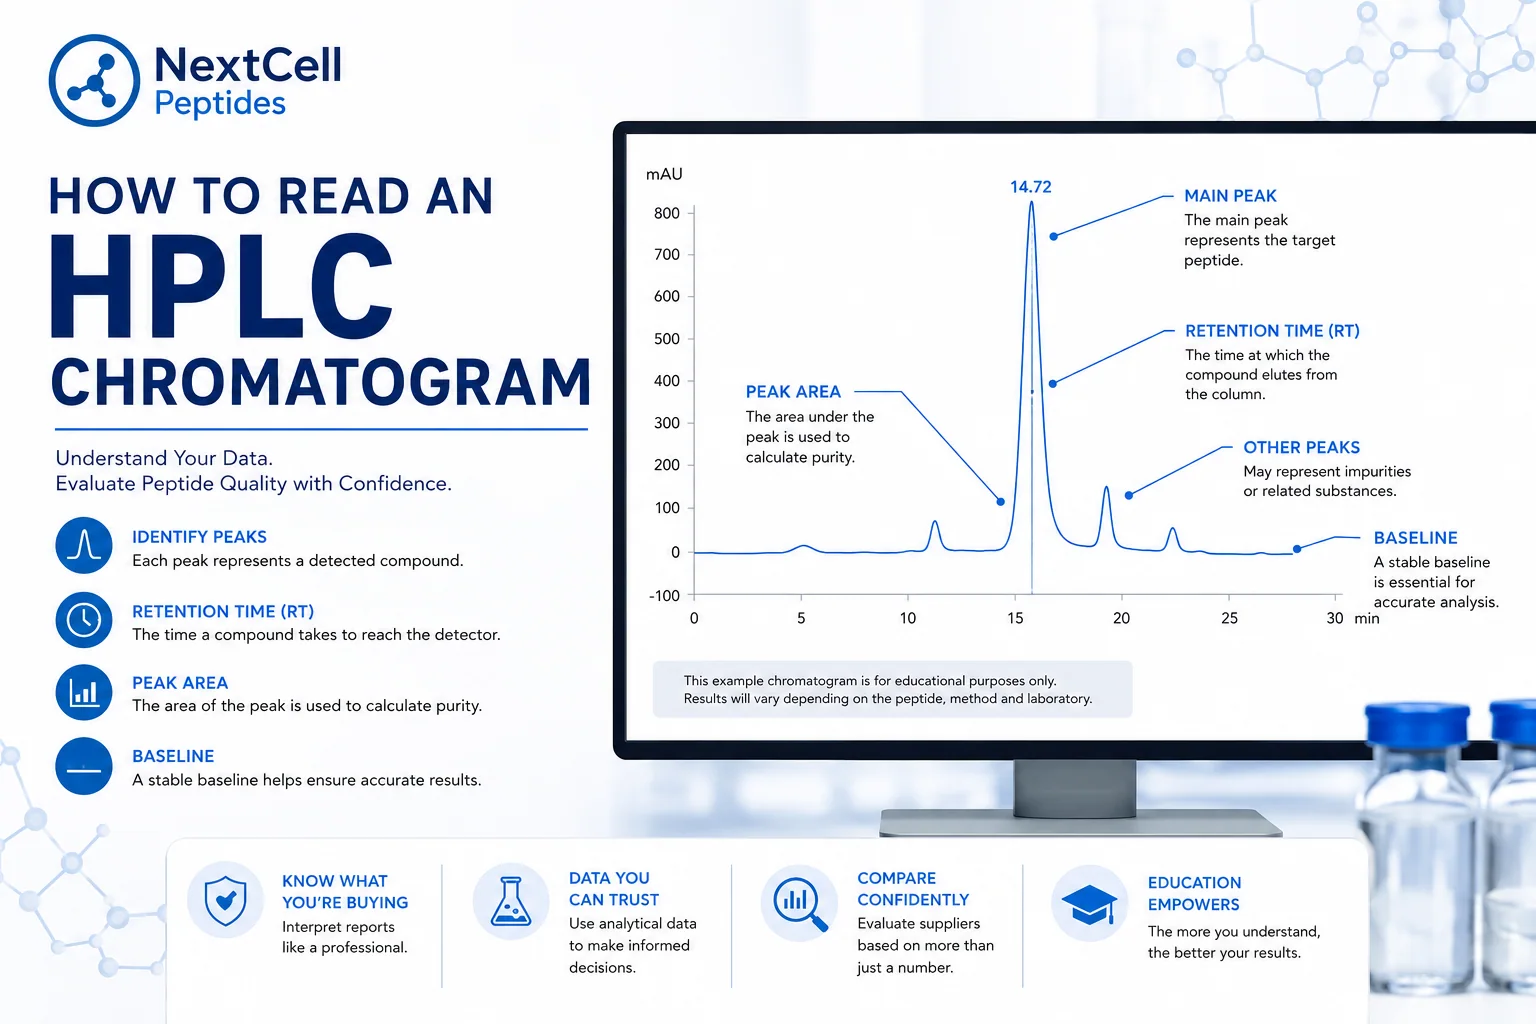
When comparing research peptide suppliers, one document appears more frequently than almost any other: the High-Performance Liquid Chromatography (HPLC) chromatogram.
Many buyers recognize the familiar graph filled with peaks and immediately associate it with product quality. However, relatively few understand what the chromatogram actually shows—or just as importantly, what it does not show.
Learning to interpret an HPLC chromatogram allows buyers to evaluate analytical reports more confidently, ask better questions and avoid relying solely on marketing claims or simplified purity percentages.
This guide explains the fundamentals of HPLC chromatograms, how they are generated, what the different elements represent and how experienced buyers interpret analytical reports when comparing research peptide suppliers.
What Is an HPLC Chromatogram?
An HPLC chromatogram is a graphical representation of the analytical signal produced during High-Performance Liquid Chromatography (HPLC).
During analysis, the sample passes through a chromatography system where different compounds separate based on their interactions with the stationary and mobile phases. As these compounds leave the analytical column, they are detected and recorded as peaks on a graph.
The resulting chromatogram provides a visual representation of the sample under the specific analytical conditions used during testing.
Rather than serving as a certificate of quality on its own, the chromatogram is one part of a broader analytical process used to evaluate research materials.
Why Buyers Should Understand HPLC Reports
Many suppliers mention HPLC testing without explaining what the results actually mean.
Understanding the basics helps buyers interpret analytical reports more critically instead of relying solely on simplified marketing statements such as "99% purity."
Experienced buyers often want to understand:
What does each peak represent?
Why are there multiple peaks?
Does one large peak automatically mean higher quality?
What information can a chromatogram actually provide?
What additional analytical information may also be important?
Learning the answers to these questions provides a stronger foundation for comparing research peptide suppliers objectively.
What Does an HPLC Chromatogram Show?
At first glance, an HPLC chromatogram appears to be a simple graph.
In reality, every part of the graph contains analytical information generated during testing.
Although chromatograms vary between laboratories and analytical methods, most contain the same basic components.
These typically include:
Baseline
Analytical peaks
Peak height
Peak area
Retention time
Detector response
Understanding these elements makes it much easier to interpret analytical reports with confidence.
The Baseline
The baseline is the relatively flat line running across the chromatogram before, between and after analytical peaks.
It represents the detector response when no measurable compound is passing through the detector.
A stable baseline generally allows peaks to be identified and measured more accurately, while fluctuations may make interpretation more challenging depending on the analytical conditions.
Analytical Peaks
The peaks are the most recognizable part of any chromatogram.
Each peak represents a detected compound under the analytical conditions used during the test.
In peptide analysis, the largest peak is often associated with the intended peptide, while additional peaks may correspond to other detectable compounds present in the sample.
However, interpreting peaks correctly requires understanding the analytical method and should not rely on visual appearance alone.
Why Multiple Peaks Do Not Automatically Indicate a Problem
One of the most common misconceptions is that a chromatogram should contain only a single peak.
In reality, chromatograms often contain multiple peaks depending on the sample composition, analytical conditions and detection method.
Simply observing additional peaks does not allow buyers to determine whether a product is acceptable or unacceptable.
Meaningful interpretation requires understanding the complete analytical report rather than focusing on one visual feature.
Why HPLC Is Only One Part of Quality Evaluation
Although HPLC is widely used to evaluate peptide purity, it represents only one component of overall quality assessment.
Experienced buyers rarely rely on HPLC alone.
Instead, they consider HPLC together with other factors such as:
Supplier transparency
Product documentation
Storage guidance
Manufacturing consistency
Professional labeling
Educational resources
Looking at the complete picture provides a more balanced way to evaluate research peptide suppliers than relying on a single analytical report.
Understanding Retention Time
One of the first values many buyers notice on an HPLC report is the retention time.
Retention time refers to the amount of time it takes for a detected compound to travel through the chromatographic system and reach the detector under a specific analytical method.
It is typically expressed in minutes and appears alongside the corresponding chromatographic peak.
Although retention time helps identify compounds under a validated analytical method, it should never be interpreted in isolation.
Factors such as the analytical column, mobile phase, instrument settings and testing conditions can all influence retention time. For this reason, comparing retention times from different laboratories or different analytical methods may not provide meaningful conclusions.
Experienced buyers focus on the complete analytical report rather than a single numerical value.
Peak Height vs. Peak Area
Two measurements commonly associated with chromatographic peaks are peak height and peak area.
Although they are related, they describe different characteristics of the detected signal.
Peak height measures the maximum detector response at the highest point of the peak.
Peak area measures the total signal generated by the compound as it passes through the detector.
For peptide purity analysis, laboratories generally place greater emphasis on peak area because it represents the total amount of detector response rather than only the highest point of the signal.
Understanding this distinction helps buyers interpret analytical reports more accurately.
Why the Largest Peak Is Important
In many peptide analyses, the largest peak corresponds to the primary compound being analyzed.
However, interpreting this correctly requires understanding the complete analytical context.
A large peak alone does not automatically confirm product quality, nor does the presence of smaller peaks automatically indicate a problem.
Experienced analysts evaluate:
The analytical method used.
Peak integration.
Retention time.
Detector settings.
The complete analytical report.
Looking at a chromatogram without supporting documentation provides only part of the overall picture.
What Can Additional Peaks Represent?
One of the most common questions buyers ask is why multiple peaks appear on a chromatogram.
Additional peaks may represent other detectable compounds under the analytical conditions used. Their interpretation depends on the analytical method, sample composition and the laboratory's evaluation process.
Because chromatograms can vary between laboratories, buyers should avoid drawing conclusions based solely on the number of visible peaks.
Instead, chromatograms should be interpreted together with the accompanying analytical report.
What an HPLC Chromatogram Does Not Tell You
An HPLC chromatogram is an extremely valuable analytical tool, but it also has limitations.
A chromatogram does not answer every question about a research peptide.
For example, a chromatogram alone does not determine:
The peptide sequence.
Manufacturing quality.
Sterility.
Endotoxin levels.
Shipping conditions.
Storage history.
Packaging quality.
Supplier transparency.
This is one of the reasons experienced buyers rarely rely on a single document when evaluating research peptide suppliers.
Instead, HPLC results are considered alongside other quality indicators to develop a more complete understanding of the product.
Why Purity Percentage Should Be Interpreted Carefully
Many buyers immediately look for a purity percentage on a Certificate of Analysis.
While purity is an important analytical measurement, the number itself should always be interpreted within the context of the analytical method used.
A reported purity value is only one part of the overall analytical report.
Professional buyers also consider:
Whether the analytical report appears complete.
Whether the chromatogram is consistent with the accompanying data.
Whether the supplier provides clear documentation.
Whether supporting information is available when appropriate.
Evaluating analytical reports as a whole provides a more balanced approach than focusing exclusively on a single percentage.
What Professional Suppliers Typically Provide
Research peptide suppliers vary in the amount of information they make available to buyers.
Professional suppliers often aim to provide documentation that helps customers better understand the products they are purchasing.
Examples may include:
Product specifications.
Storage recommendations.
Educational resources.
Batch identification where applicable.
Analytical documentation when available.
Clear product labeling.
Consistent product presentation.
Providing educational context alongside technical documentation helps buyers interpret information more confidently rather than simply presenting data without explanation.
Buyer Tip
When reviewing an HPLC report, avoid asking only "What is the purity?"
A more useful question is:
"Does the supplier provide enough information for me to understand how this analytical result fits into the overall quality evaluation?"
This shift in perspective encourages buyers to evaluate transparency, documentation and professionalism—not just a single number.
How to Compare HPLC Reports from Different Suppliers
One of the biggest challenges buyers face is comparing analytical reports from different suppliers.
At first glance, chromatograms may appear similar, making it tempting to judge quality based on visual appearance alone. However, meaningful comparisons require a broader perspective.
Rather than focusing on a single graph, experienced buyers evaluate the complete analytical package.
This typically includes:
The chromatogram itself.
The accompanying analytical report.
Product specifications.
Storage recommendations.
Batch identification where applicable.
Overall supplier transparency.
Comparing these elements together provides a more balanced assessment than relying on a single image or purity percentage.
Common Misconceptions About HPLC Reports
Many misconceptions continue to circulate regarding HPLC analysis.
Understanding what HPLC can—and cannot—tell you helps buyers interpret reports more accurately.
"A single peak always means a perfect product."
Not necessarily. Chromatograms should always be interpreted within the context of the analytical method and accompanying documentation.
"More peaks automatically mean poor quality."
Additional peaks simply indicate additional detected signals under the analytical conditions used. Their significance depends on the complete analytical evaluation.
"A higher purity percentage tells the whole story."
Purity is an important measurement, but it represents only one part of the overall quality assessment.
Professional buyers also evaluate documentation, transparency, storage guidance and supplier professionalism.
"Every laboratory produces identical chromatograms."
Different laboratories may use different analytical methods, columns, mobile phases and instrument settings.
For this reason, chromatograms should not be compared without understanding the analytical conditions under which they were generated.
What Experienced Buyers Look For
Experienced buyers rarely rely on a single analytical result.
Instead, they evaluate the complete purchasing experience.
Questions they commonly ask include:
Does the supplier explain the analytical documentation?
Is the chromatogram presented alongside supporting information?
Are product specifications clearly described?
Are storage recommendations available?
Is educational content provided?
Does the supplier present information consistently across the website?
Is technical information explained in a way that is easy to understand?
This broader evaluation helps buyers compare suppliers more objectively.
Buyer's Checklist
Before relying on an HPLC report, consider the following questions.
✓ Is the chromatogram accompanied by supporting information?
✓ Are retention time and peak information clearly presented?
✓ Does the supplier explain analytical terminology?
✓ Is documentation organized and easy to understand?
✓ Are storage recommendations available?
✓ Is batch information provided where appropriate?
✓ Does the supplier publish educational resources?
✓ Is the overall presentation professional and consistent?
The more complete the information, the easier it becomes to evaluate analytical reports with confidence.
Related Research Guides
Understanding HPLC analysis is only one part of evaluating research peptide quality.
To build a more complete understanding, continue with these guides:
Together, these resources provide a practical framework for understanding analytical testing, storage, supplier transparency and informed purchasing decisions.
Summary
An HPLC chromatogram is one of the most valuable analytical tools used in research peptide quality assessment, but it should never be interpreted in isolation.
Understanding concepts such as retention time, peak area and detector response helps buyers interpret analytical reports with greater confidence while avoiding common misconceptions.
At the same time, experienced buyers recognize that meaningful product evaluation extends beyond a single chromatogram. Supplier transparency, educational resources, storage guidance, product documentation and professional presentation all contribute to a more complete understanding of product quality.
Rather than focusing on one graph or one percentage, informed buyers evaluate the complete picture.
By understanding how HPLC chromatograms are generated and what they represent, researchers are better equipped to compare suppliers objectively, ask more informed questions and make purchasing decisions based on evidence rather than assumptions.